When your day is long, and you are intellectually spread thin, nothing refreshes like a quick afternoon map.
I don’t know about you, but even when I can’t focus on anything else, maps are easy to fall into and get lost. They are places where I can dream, in both space and time, of the captivating worlds that we study in school. I can wander through maps, like a nomad wandering through a desert, and I can find myself face to face with wonders. And what is great about maps is that in no time at all the scope and perspective of the past and present can be visualized clearly and with great complexity. You could call this power mapping. But the best power mapping process requires a tool equivalent to the task. We are calling that new application Cartograf, and we are inviting you to visit its first installation online at http://cartograf.learnquebec.ca/ and take the time out to try it and start thinking about how you could make it part of your daily routine.
Cartograf in a Nutshell
Instigated, designed and developed by teachers and counselors at the RECIT en univers social (RECITUS), together with LEARN team members like myself and several other partner organizations, the Cartograf application originally responded to student skills contained in the Geography and History programs in the QEP (Quebec Education Program). In familiar terms that could apply to other subjects too, these programs require students to:
- Examine phenomena from various perspectives (think different aerial views, zooming in to street level, examining relevant photographs!).
- Situate those phenomena in space and time (think of pinning “markers” on the globe!).
- Gather and organize facts, which they must also interpret (think coloured maps, legends, shapes, labels and descriptions).
- Compare the information gathered to other facts, which is then shared with other students, and becomes the centre of debate, opinions and conclusions (think now of more than one map, viewed simultaneously or in alternation).
Though each competency or skill is relatively evident and simple to accomplish, when taken all together, the process social scientists follow is one that is complex. Until now, what was lacking was a tool that allowed for that complexity to be played out with students.
Why Cartograf?
So why not just use existing tools like Google Earth, Google Maps and alternatives like OpenStreetMaps? In this case, less is more. Cartograf basically uses all three technologies at once, allowing students to toggle from one view to another without changing tools – making the tool more practical for classroom use. Cartograf also bypasses thorny security issues because student access and private information is managed by RECITUS or LEARN.
Students who are developing competency through an examination of phenomena do more than just read and draw on maps. They interpret territory and societies in Geography and History. In other subjects, similar processes help them deconstruct cultural representations, artwork, texts and other documents. With these student processes in mind, a second challenge emerged for the designers of the Cartograf application: to be able to include texts, images and documents within the mapping space, and to have at one’s finger tips the tools (such as more complex sketching tools, custom legends, and customizable iconography) needed to more completely interpret our world.
 A Student Scenario
Imagine a scenario like this in your class: A student uses one of Cartgraf’s mapping tools to zoom in to a historically important neighbourhood in England, and she places a pin or “marker” at that location. Within that marker she makes initial observations using a built-in word processor; she can even link to a video on Youtube.
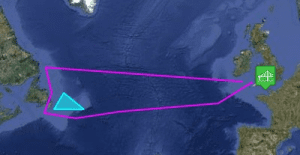
Using simple drawing tools, she delineates other areas of her map, uses icons to label points of significance, inserts shapes and lines to explain worlds both past and present.
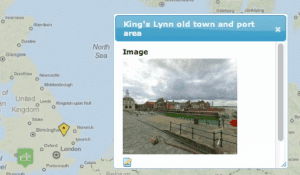 Perhaps our student would like to do more for certain key points. She uploads representative images collected elsewhere on the internet (such as photos, relevant artwork, or scans of primary source documents). And then, to further examine a monument, an old quarter or port as it exists today, she uses the built-in Google Street View feature to capture that moment in a marker, and she includes it it as part of her project.
 Let’s say that our student wants to interpret her documents even further. Imagine the sort of programs she would need to sketch her ideas right on the images she has collected – Photoshop, Illustrator, etc. Without leaving the Cartograf application, and without installing any other software, she can click a button to reveal a complete drawing suite called SVG Edit. This allows her to trace ideas over the uploaded documents. These edited sketches are retained within the location markers, thereby keeping her work in the context of her map and assignment.
Now imagine she is not alone and she wants to work collaboratively with others! When students use Google Map services they are able to share maps by sending them through email. But what they can’t easily do is work together on maps with other students. Similarly, the teacher task of marking different mapping assignments can be daunting, requiring the same sort of mailing of links or access to individual maps one at a time. Cartograf is an application for teachers and students that eliminates the hassle involved in sharing and working simultaneously on the same projects.
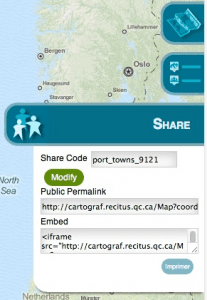 For example, now two students are working on mapping historical sites in England. They might start out on their own, then move to using the sharing feature in Cartograf. The sharing feature allows them to see (but not edit) each other’s work, toggle their partner’s points off and on, and view their combined document collections and sketches in progress. Once all the students’ tasks are complete, they can then share their maps with their teacher. The teacher can also share starter maps and instructions to students.
Using a system of secret tags for sharing and security eliminates any need for a teacher administration section and therefore doesn’t burden the user with additional management interfaces to learn.
In short, Cartograf allows the teacher and students to learn using maps and images, to situate their learning on a worldwide stage, and to visualize their interpretation and opinions using only one tool. It is a rare example of an online collaborative application that is easy to use and quick to manage, yet is powerful and limited only by the user’s imagination.
If you want to see how a mapping tool like Cartograf could be used in the context of a complete LES, consider the LES recently produced by RECITUS/LEARN for Secondary Geography on the Saguenay-St. Lawrence Marine Park: A Protected Territory at https://www.learnquebec.ca/geography#teach Students can now use Cartograf in this LES to identify and describe Marine Parks around the world. The other tools in Cartograf could help them sketch the territory and indicate players and factors involved.
Could your students use a little power mapping to get them through the day? How might you use Cartograf in your subject area? What could you do with images, maps, views and the ability to draw on documents in your class? Consider commenting to this post and sharing your ideas!

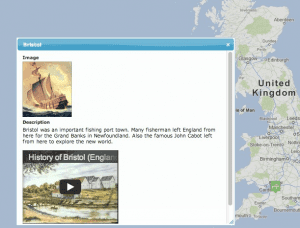 A Student Scenario


Hi Paul,
This looks amazing. I may show my ignorance here but do we have a webinar on this? Is it ready yet? I was away at a qualitative research and technology conference this past week and the need for tools such as these was expressed. I am wondering about how it could be used in such a context.
Thanks for sharing this in such a delightful way.
The installation on Recitus of Cartograf is ready at http://cartograf.recitus.qc.ca. There will be some tweaks to this installation in the future, but the address will remain the same and it is usable now for short projects and testing. LEARN will have our own installation shortly. As for webinars, it was covered briefly in my last webinar and may be highlighted near the end of the year or early next year in an online presentation yes. For now we are looking for teachers who wish to get a head start, be part of a focus group, and pilot ideas using the tool.
Après l’atelier sur Cartograf à AQUOPS par Marianne Giguère et Steve Quirion de RECITUS, sur le blogue d’AQUOPS vous pouvez lire un texte par Mélyssa Gesbert-Huot. Voir son article à http://www.aquops.org/wordpress/?p=1314